

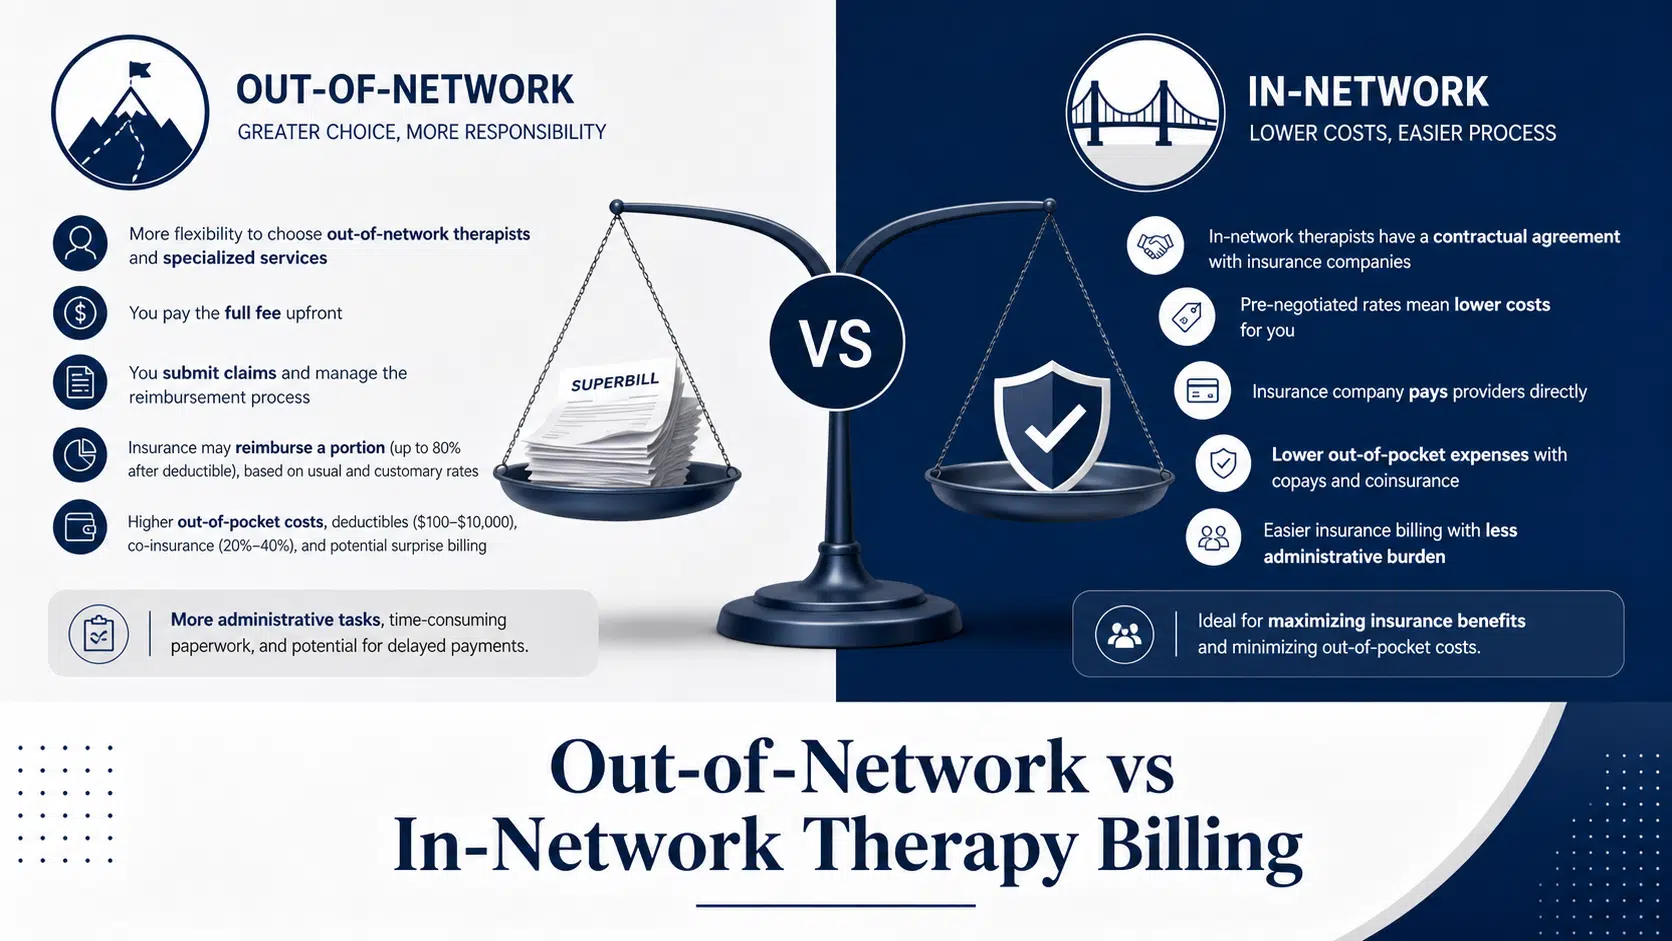
Out-of-Network vs In-Network Therapy Billing
10 min read
Key Takeaways Revenue cycle KPIs are quantifiable measures that track how efficiently your behavioral health organization converts clinical services into collected revenue. This guide is written specifically for addiction treatment centers, RTCs, PHPs, IOPs, and outpatient psychiatry practices navig
Cipher Admin
Cipher Billing Team
Key Takeaways Revenue cycle KPIs are quantifiable measures that track how efficiently your behavioral health organization converts clinical services into collected revenue. This guide is written specifically for addiction treatment centers, RTCs, PHPs, IOPs, and outpatient psychiatry practices navig
Revenue cycle KPIs are quantifiable measures that track how efficiently your behavioral health organization converts clinical services into collected revenue. This guide is written specifically for addiction treatment centers, RTCs, PHPs, IOPs, and outpatient psychiatry practices navigating the 2024–2026 payer landscape.
Use the next section as a quick reference before diving into the full breakdown.
Revenue cycle KPIs are key performance indicators that measure how efficiently a practice turns clinical work—therapy sessions, group programming, residential days—into cash collected in the bank. Measuring the effectiveness of a healthcare revenue cycle requires tracking KPIs that span the entire patient journey, from registration to final payment.
For behavioral health and addiction treatment organizations, revenue cycle management carries unique complications. Frequent out-of-network reimbursement negotiations, intensive medical necessity reviews, high utilization review burdens from payers, extended lengths of stay exceeding 30 days, and elevated patient financial responsibility create a complex revenue environment that general medical billing approaches often miss.
Without consistent KPI tracking, facilities commonly experience denial rates climbing to 10–15%, accounts receivable aging beyond 60 days, unpredictable cash flow disrupting operations, and compliance risks with state Medicaid agencies or CMS. The Healthcare Financial Management Association (HFMA) identifies 29 “MAP Keys” as the industry standard, categorized into five core areas—but behavioral health organizations need to prioritize the metrics most relevant to their specific challenges.
At Cipher Billing, we’ve operated exclusively in behavioral health RCM since 2017. Our metrics—including 100% pre/post-payment review, average inpatient day rates of $1,821.49, and 8–9 minute VOB turnaround—demonstrate what’s possible when KPIs drive daily operations.
This section is the heart of the article: a practical list of 15 high-impact revenue cycle KPIs drawn from industry standards and Cipher Billing’s internal performance data. Each KPI includes what it measures, a formula, 2024–2026 benchmark ranges, and a behavioral-health example.
These metrics are grouped into four functional areas—Pre-Service, Billing & Claims, Payment & Collections, and Overall Financial Health—but presented in a single scrollable section. Efficiency at the start of the revenue cycle directly impacts back-end success, so we begin with collection-focused metrics.
Net collection rate is the single most important metric because it measures what percentage of expected revenue you actually collect after contractual adjustments. A low NCR may indicate issues such as unappealed denials, underpayments, or poor contract management.
Low NCR in 2024–2026 typically stems from unworked denials, underpayments on out-of-network claims, and write-offs from weak medical necessity documentation. Track NCR by date of service and by payer to uncover underperforming contracts.
Days in accounts receivable measures the average number of days it takes for healthcare facilities to receive payments from patients and insurance companies. A higher figure can indicate submission delays, ineffective follow-up, or incomplete documentation.
To calculate days in accounts receivable, divide total accounts receivable by average daily charges. Break out Days in A/R by payer class—commercial, Medicaid, Medicare Advantage, self-pay—to avoid averages hiding problem segments.
First-Pass Payment Ratio measures the percentage of claims paid on first submission without manual intervention or appeal. This reflects the strength of front-end work: eligibility verification, VOB quality, authorization accuracy, and coding compliance.
Track FPPR by payer and level of care since residential and detox claims face more documentation scrutiny than outpatient psychiatry.
Denial rate measures the percentage of claims denied by payers on initial submission. High denial rates can disrupt cash flow and operational efficiency. Common causes of claim denials include coding errors, eligibility issues, and documentation deficiencies.
The denial due to authorization percentage measures the value of claims denied for authorization issues against total denials—a critical breakdown for behavioral health. Cipher’s 97% medical necessity appeal success rate relies on this granular root cause analysis.
The clean claim rate is the percentage of claims submitted without errors, indicating the efficiency of the claims processing system. A higher rate signifies effective billing practices, while a lower rate indicates inefficiencies that may lead to failed reimbursements.
High clean claim rates in behavioral health come from fast, accurate VOB and audit-based onboarding. Review your top 10 error codes monthly and build EHR prompts to prevent repeats.
Charge lag measures the number of days between service date (or discharge for residential) and claim submission. The average billing lag should be less than 48 hours for outpatient, with residential programs sometimes extending up to 7 days.
In 2024–2026, many payers tightened timely filing limits to 90–120 days. Track charge lag by program and provider to identify workflow bottlenecks like delayed group note signing.
This metric shows the portion of accounts receivable over 90 days old—funds at higher risk of never being collected.
High 90+ A/R often stems from unresolved payer disputes on high-dollar residential stays. Break aging down by payer and balance size to focus on high-impact recoveries.
Insurance write-off percentage measures revenue permanently written off after all collection efforts—distinct from contractual adjustments.
Flag all write-offs over $5,000 for leadership review to ensure they’re justified, not convenience write-offs.
The bad debt rate measures the percentage of accounts receivable that are left unpaid, indicating uncollectable claims that facilities must write off. A high rate suggests a need to enhance collection processes or secure payments more effectively.
High-deductible health plans have increased patient balances since 2020, making proactive counseling and payment plans essential. Separate patient bad debt from insurance bad debt when tracking trends.
The cost to collect is the overall cost incurred to collect money, including direct, indirect, overhead, general, and administrative costs.
Extremely low cost to collect might indicate underinvestment in follow-up, leading to hidden revenue leakage. Review quarterly, especially when comparing in-house billing versus partnering with specialized RCM.
This metric shows revenue collected per unit of service, accounting for payer mix and level of care.
Track by payer and program across quarters to detect undercoding or payer policy changes affecting reimbursement.
VOB turnaround is a leading indicator measuring how quickly your team confirms eligibility and coverage before admission. Point-of-Service Collections track the percentage of patient responsibility collected prior to or at service time—fast VOB enables this.
Faster VOB means fewer admission delays, better patient satisfaction, and accurate expectation-setting for deductibles and OON balances.
This measures the percentage of scheduled appointments patients miss or cancel too late to backfill.
High no shows erode revenue per provider and disrupt care continuity. Integrate automated reminders and telehealth options to improve.
Appeal rate shows what percentage of denied claims your team actively works rather than writing off.
Pair appeal rate with success rate to ensure you’re choosing winnable appeals with thorough documentation.
This measures how much of billed charges you collect from out-of-network payers—critical for many addiction treatment programs.
Track by payer and year to evaluate whether your negotiation strategy and state surprise billing protections are working.
Dozens of KPIs exist, but most behavioral health leaders can’t monitor everything weekly. Regular reviewing of operational metrics is crucial for accountability without overwhelming your team.
Use this three-tier model:
This structure ensures healthcare leaders focus on the right metrics without data overload.
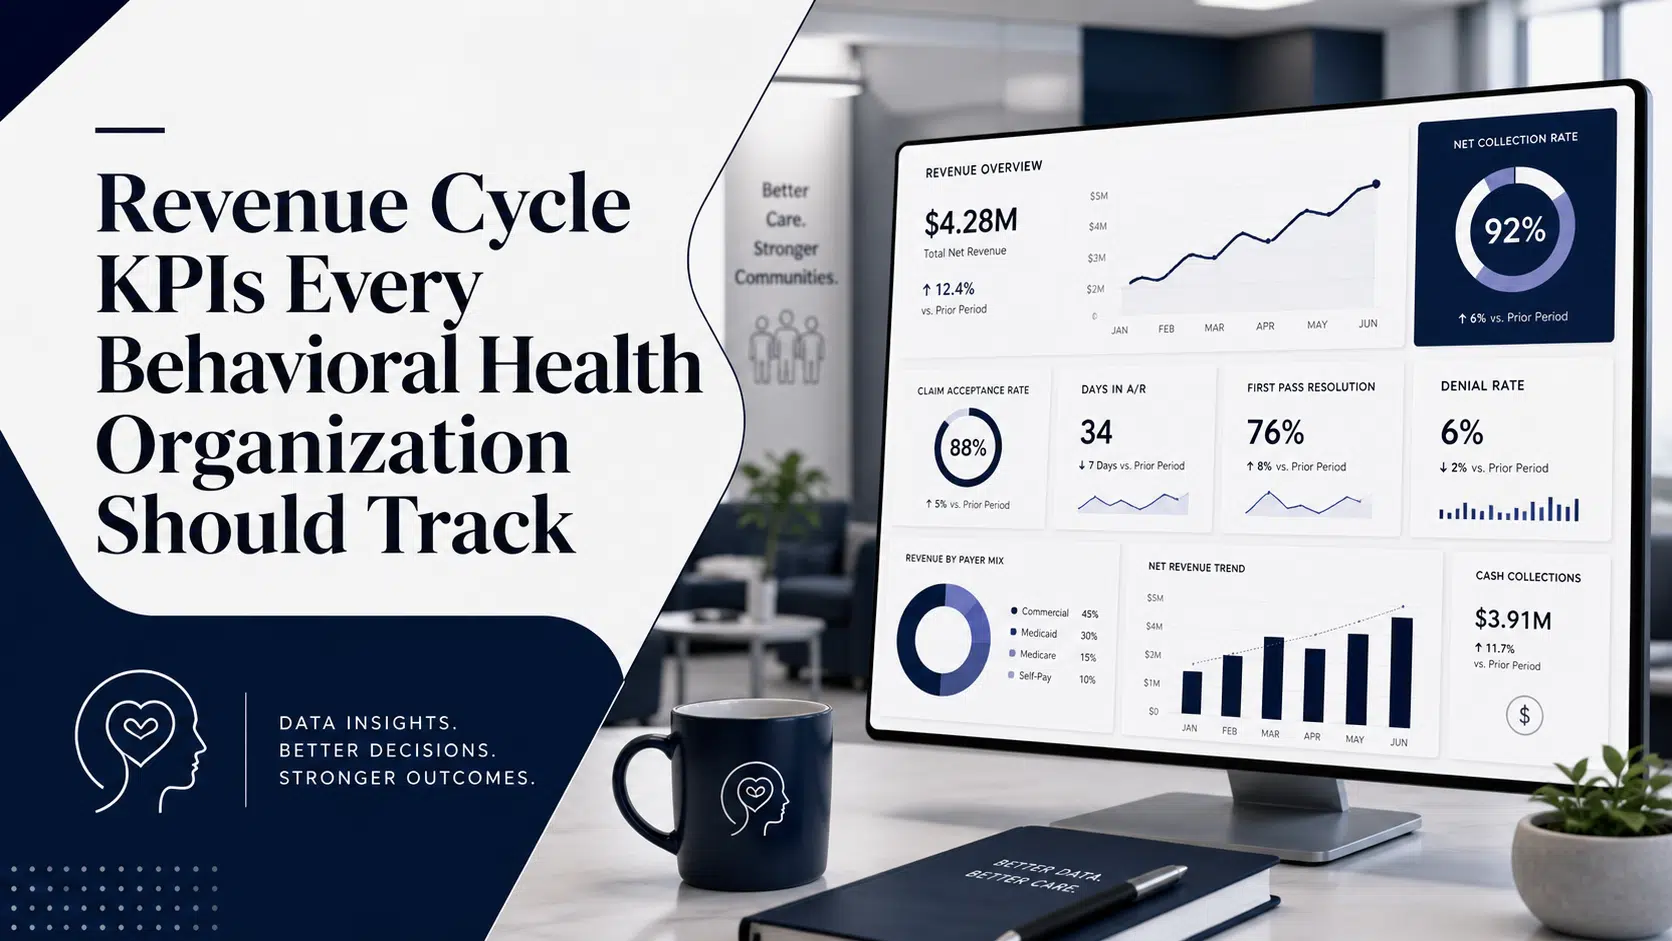
A revenue cycle KPI dashboard provides real time visibility by combining data from your EHR, clearinghouse, and accounting software into a single view. Using automated dashboards to monitor metrics enables practices to identify bottlenecks and reduce denial rates.
Essential data sources include:
Cipher Billing operates EHR-agnostically, pulling claims data directly from your existing platforms. Group dashboard widgets by revenue cycle phases: Pre-Service (VOB, prior authorization, no-shows), Billing (Charge Lag, Clean Claim Rate), Payment (Days in A/R, Denial Rate), and Post-Payment (Write-Off %, Cost to Collect).
Display both current month and trailing 3–6 month trends for actionable insights into whether you’re improving.
KPIs only matter if they lead to specific action plans, not just monthly reports. The unbilled claims percentage should ideally be kept under 2%, indicating claims are billed promptly—but knowing this only helps if you act on it.
Run a monthly RCM review where leadership examines 3–5 core KPIs and assigns owners for negative trends. For example, if denial rate jumps from 6% to 11% between January and March 2025, implement root cause analysis, retrain intake on eligibility, and update UR templates.
Cipher uses a closed-loop approach: detect a KPI change, investigate source data, implement a process fix, then measure again over 60–90 days. This directly impacts your organization’s ability to maintain financial viability.
Cipher Billing represents “A Higher Level Partnership” for behavioral health providers needing more than generic medical billing support. Our real KPI outcomes include:
Our audit-based onboarding catches documentation and coding gaps before claims go out, directly improving Clean Claim Rate and FPPR from day one. Your dedicated Partner Experience Executive—U.S.-based, not outsourced—brings behavioral health expertise to every conversation.
Ready to review your 2024–2026 KPIs and identify the fastest improvements? Schedule a consultation or call (949) 368-0575.
Most organizations do well monitoring 5–7 KPIs monthly—NCR, Days in A/R, Denial Rate, FPPR, Clean Claim Rate, A/R 90+ %, and Cost to Collect—then reviewing the full list quarterly. Tracking too many metrics weekly overwhelms smaller teams. Cipher typically implements a phased KPI rollout over the first 90 days of a new partnership, starting with the Critical Few before expanding.
Some KPIs respond quickly—Charge Lag and VOB Turnaround can improve within 30 days of workflow changes. Net Collection Rate and Cost to Collect usually take 3–6 months to show reliable trends. A/R 90+ % often lags improvements by one to two quarters because it reflects older claims still in the system. Set realistic milestones, such as targeting a 2–3 point FPPR increase over six months.
At minimum, you need consistent data from your EHR/practice management system, clearinghouse reports, and accounting software, with agreed-upon definitions for each KPI. BI tools that connect to systems like Kipu, Avea, Sunwave, or ZenCharts work well, or partner with Cipher Billing’s built-in KPI reporting frameworks. Manual spreadsheet tracking works temporarily but becomes error-prone as patient volume grows.
Recent contract renegotiations with stricter medical necessity criteria and tighter prior authorization requirements can increase denial rates and lower Average Revenue per Patient Day if not actively managed. Track NCR, Denial Rate, and ARPD/ARPV by payer before and after major contract changes. Cipher routinely reviews payer performance data and supports clients in negotiating unfavorable patterns using documented KPI trends.
Even solo and small-group practices benefit significantly from tracking NCR, Days in A/R, Denial Rate, and No-Show Rate since these directly affect daily cash flow. The total self pay cash collected and insurance coverage verification matter regardless of size. Smaller practices may review simple monthly summaries while larger residential centers use daily dashboards. Cipher works with both high-volume outpatient clinics and residential programs, tailoring KPI depth to each organization’s bandwidth.
About the Author
Cipher Billing Team
In This Article
Cipher Billing specializes in behavioral health revenue cycle management. Reach out for a free consultation and see how we can maximize your reimbursements.